Loading packages
library(MASS)
library(dplyr)
library(tidyr)
library(ggplot2)
library(knitr)
opts_chunk$set(tidy.opts=list(width.cutoff=60),tidy=TRUE)
Problem 1. For this problem we’ll use the diamonds dataset from the ggplot2 package. Use the functions inside dplyr and ggplot2 packages to answer the following questions.
# Change the object of diamonds dataset from tibble to data frame.
diamonds <- as.data.frame(diamonds)
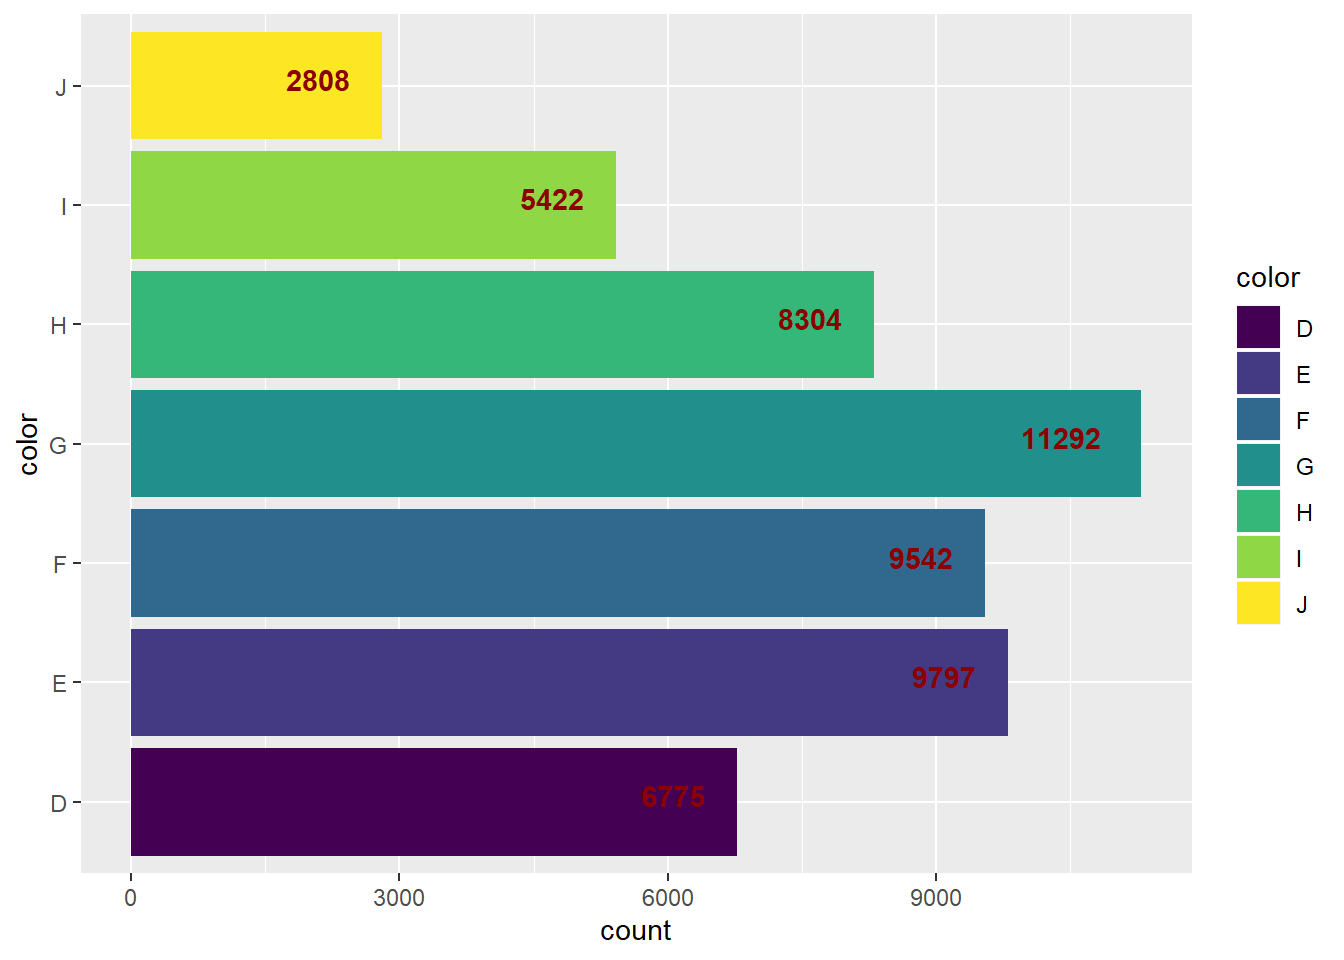
(a) Draw a bar chart to display the total number of diamonds in the diamonds dataset, grouped by color grading.
diamonds%>%
  ggplot(aes(color))+
  geom_bar(aes(group = color, fill = color))+
  coord_flip()+
  geom_text(stat='count', aes(label=..count..), vjust=0.2, hjust = 1.5,
            colour = "darkred", fontface = "bold")
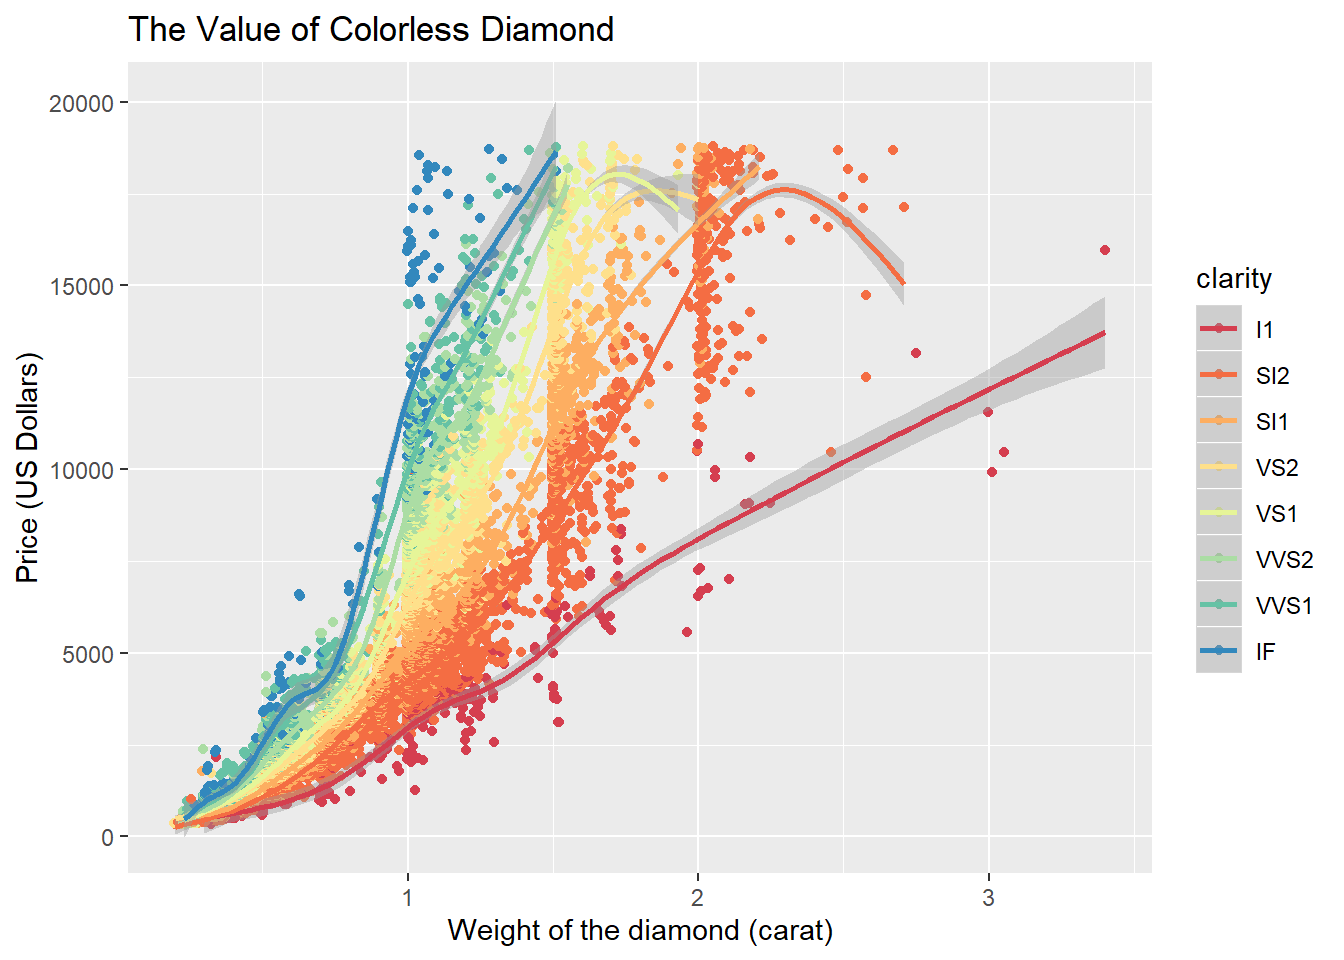
(b) We call diamond is colorless if color grading is D, E, or F. Select colorless diamonds from the diamonds dataset and assign it to colorless_diamonds for later use.
colorless_diamonds <- diamonds%>%
                          filter(color %in% c("D","E","F"))
(c) Use colorless_diamonds data frame to recreate the uploaded “The Value of Colorless Diamond” plot.
  colorless_diamonds%>%
  ggplot(aes(carat,price, color = clarity))+
  geom_jitter()+
  geom_smooth()+
  scale_color_brewer(palette = "Spectral")+
  labs(x="Weight of the diamond (carat)", y = "Price (US Dollars)",
       title = "The Value of Colorless Diamond")
## `geom_smooth()` using method = 'gam' and formula 'y ~ s(x, bs = "cs")'
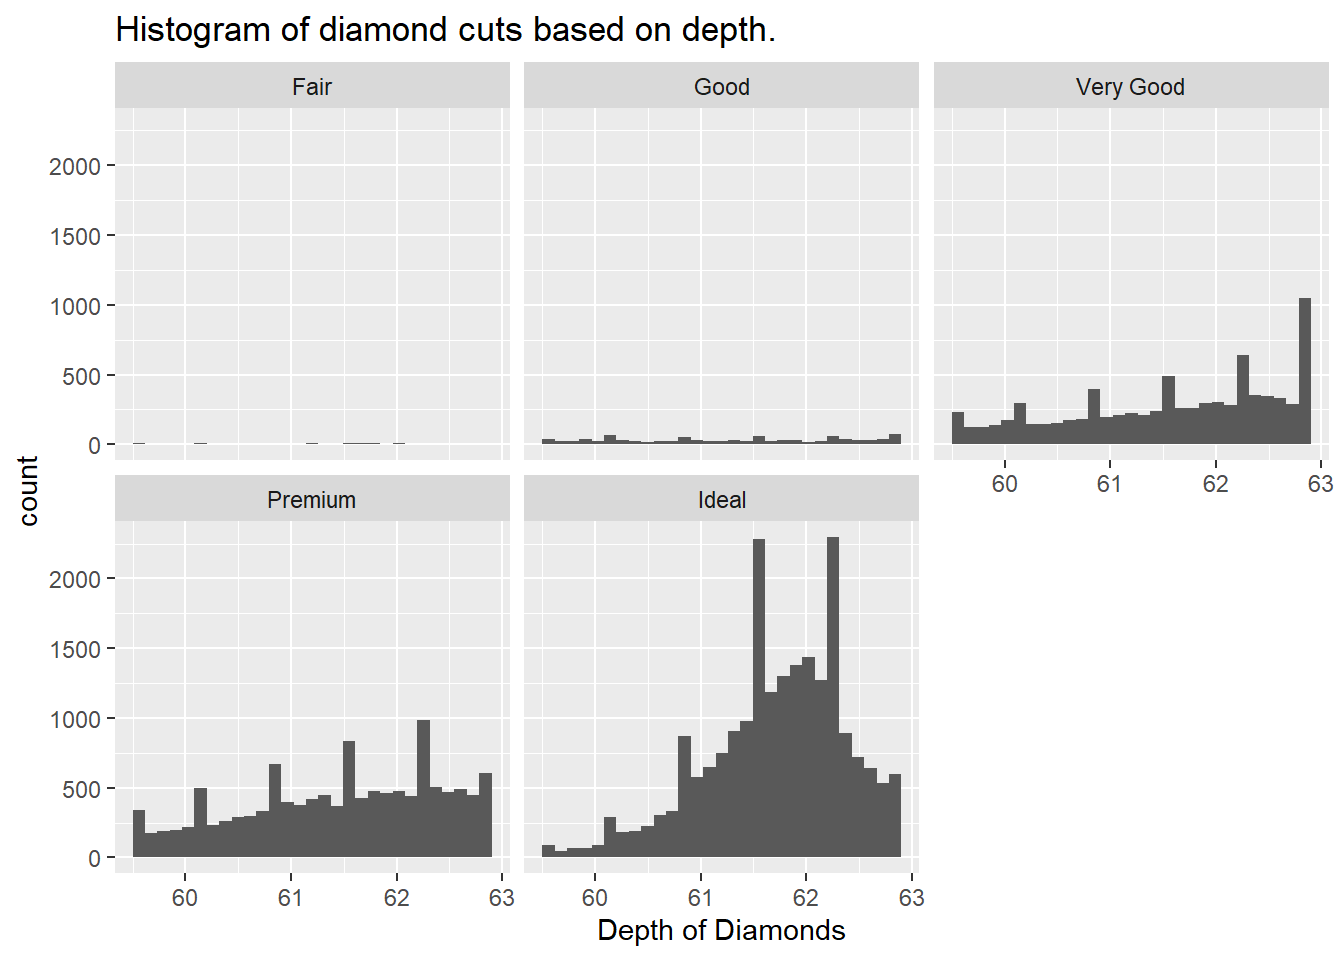
(d) The ideal depth for round diamond is between two percentages 59.5% and 62.9%, inclusive. Select the ideal depth diamonds from the diamonds dataset and assign it to ideal_depth_diamonds for later use.
ideal_dept_diamonds <- diamonds%>%
  filter(diamonds$depth >= 59.5 & diamonds$depth <= 62.9)
(e) Use ideal_depth_diamonds data frame to draw the histogram of the depth for each quality of the cut separately in one graphic window.
ideal_dept_diamonds%>%
  ggplot(aes(depth))+
  geom_histogram(bins = 30)+
  labs(x = "Depth of Diamonds",
       title = "Histogram of diamond cuts based on depth.")+
  facet_wrap(~ cut)
(f) The length and width ratio gives an idea how big or small the diamond will appear, also defining its shape. To calculate the length and width ratio just divide the length (x) of the diamond by its width (y). Add a new variable named LWratio to the diamonds dataset and assign it to LW_diamonds.
LW_diamonds <- diamonds%>%
  mutate(LWratio = x/y)